When the S&P CoreLogic Case-Shiller and Federal Housing Finance Agency's price reports for March were released we wrote that the superlatives were getting tired. The April report has prompted Case Shiller to roll out the term "extraordinary." Where do we go from here?
The Case-Shiller U.S. National Home Price Index, which covers all nine census divisions, reported a 14.6 percent annual gain in April, up from 13.3 percent in March. It was the 11th straight month of increasing prices. The 10-City Composite posted a 14.4 percent increase and growth on the 20-City Composite was 14.9 percent. In March, their respective changes were 12.9 percent and 13.4 percent.

The monthly gains were just as significant. On a non-seasonally adjusted basis, the National Index and the 20-City Composite were each up 2.1 percent while the 10-City rose 1.9 percent. After adjustment, the National and 20-City grew 1.6 percent and the 10-City gained 1.4 percent. All 20 cities reported increases before and after seasonal adjustments and all gained more in the 12 months ended in April than in the 12 months ended in March.
Phoenix, San Diego, and Seattle reported the highest year-over-year gains among the 20 cities in April. Phoenix led the way for the 23rd month with a 22.3 percent annual increase, followed by San Diego with a 21.6 percent gain and Seattle at 20.2 percent. Although prices were strongest in the West (+17.2 percent) and Southwest (+16.9 percent), every region logged double-digit growth.
Craig J. Lazzara, Managing Director and Global Head of Index Investment Strategy at S&P Dow Jones said, "April's performance was truly extraordinary. The 14.6 percent gain in the National Composite is literally the highest reading in more than 30 years of S&P CoreLogic Case-Shiller data. Housing prices in all 20 cities rose; price gains in all 20 cities accelerated; price gains in all 20 cities were in the top quartile of historical performance. In 15 cities, price gains were in top decile. Five cities - Charlotte, Cleveland, Dallas, Denver, and Seattle - joined the National Composite in recording their all-time highest 12-month gains.
"We have previously suggested that the strength in the U.S. housing market is being driven in part by reaction to the COVID pandemic, as potential buyers move from urban apartments to suburban homes. April's data continue to be consistent with this hypothesis. This demand surge may simply represent an acceleration of purchases that would have occurred anyway over the next several years. Alternatively, there may have been a secular change in locational preferences, leading to a permanent shift in the demand curve for housing. More time and data will be required to analyze this question.
CoreLogic Deputy Chief Economist Selma Hepp also pointed out that the April numbers constituted the strongest home price growth in the data series which began in 1987. She said, "While the acceleration may be met with concerns, mortgage interest rates remain 50 percent lower than they were in 2005, when home price growth last peaked, keeping the ratio of mortgage payments to monthly household income lower today. It's probable that continued massive demand will keep pressure on prices, which are likely to remain at double-digit growth rate throughout the remainder of 2021."
The "extraordinary" gains have now left pre-recession levels in the dust. The National Index is 34.9 percent higher than its previous peak in July 2006. The 20-City Composite has moved 24.5 percent above its last peak and the 10-City is up 19.4 percent.
The S&P CoreLogic Case-Shiller Home Price Indices are constructed to accurately track the price path of typical single-family home pairs for thousands of individual houses from the available universe of arms-length sales data. The National U.S. Home Price Index tracks the value of single-family housing within the United States. The indices have a base value of 100 in January 2000; thus, for example, a current index value of 150 translates to a 50 percent appreciation rate since January 2000 for a typical home located within the subject market.
As of April 2021, the National Index was at 249.04 compared to 243.66 in March. The 10- and 20-CityComposites had readings of 270.21 and 257.10, up from 264.77 and 251.66 the prior month. Los Angeles has the highest index reading at 339.18. Detroit remained at the bottom of the list for the second month with a reading of 147.70.
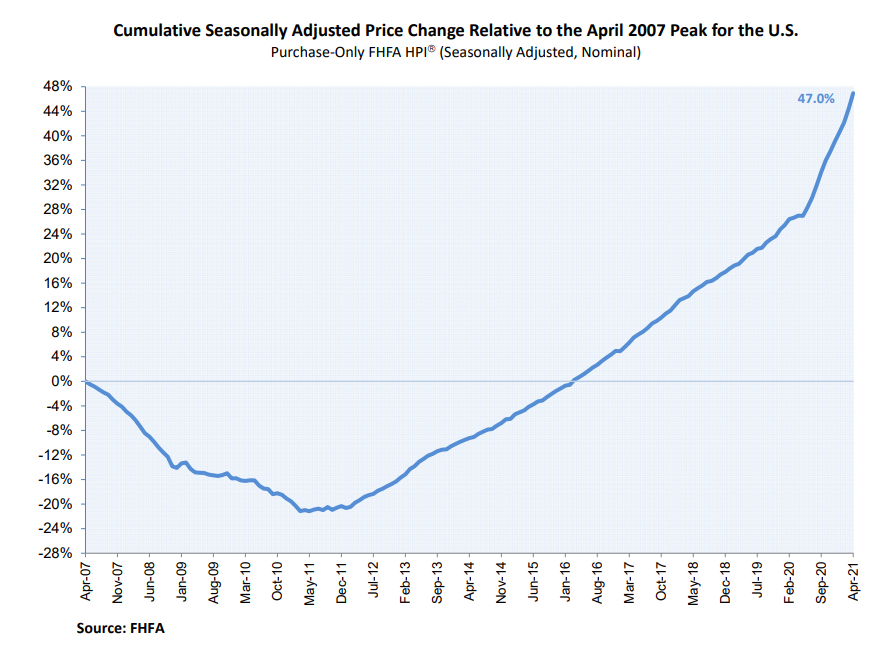
April data from the FHFA paints a similar picture. The agency's House Price Index (HPI) was up 1.8 percent month over month and 15.7 percent compared to April 2020. The previously reported 1.4 percent price change from February to March 2021 was revised upward to 1.6 percent.
"House prices recorded another monthly and annual record in April," said Dr. Lynn Fisher, FHFA's Deputy Director of the Division of Research and Statistics. "This unprecedented price growth persists due to strong demand, bolstered by still-low mortgage rates, and too few homes for sale."
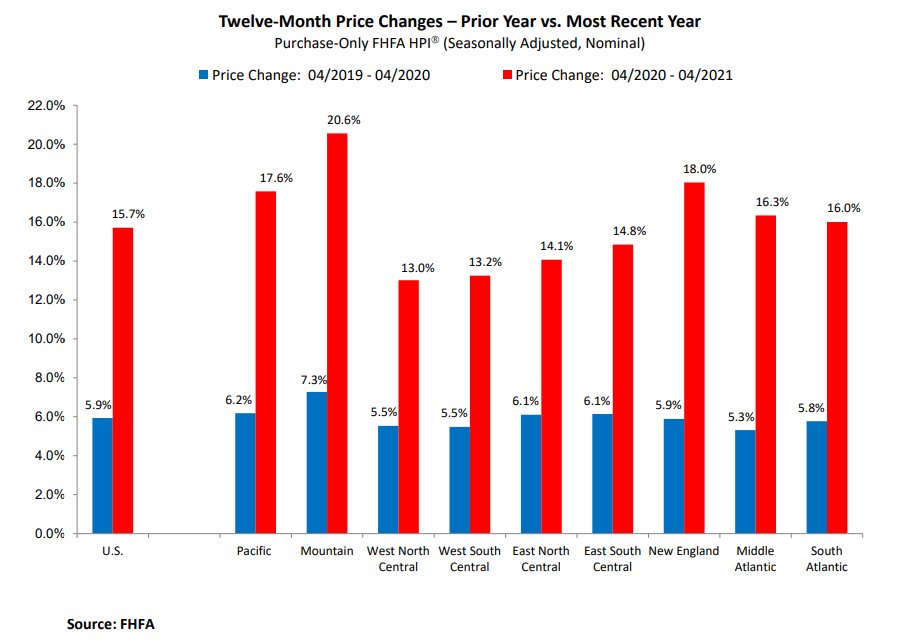
For the nine census divisions, seasonally adjusted monthly house price changes from March 2021 to April 2021 ranged from 1.2 percent in the West North Central division to 2.6 percent in both the Mountain and Middle Atlantic divisions. The 12-month changes ranged from 13.0 percent in the West North Central to 20.6 percent in the Mountain division.
FHFA's HPI is based on the sales price of home financed by the GSEs Fannie Mae and Freddie Mac. The index was benchmarked at 100 in January 1991. The current reading is 331.2.