


Until a few weeks ago, it looked like we might have seen the last of 7% mortgage rates, but the last 2 weeks have been brutal. The culprit has been a collection of several scheduled economic reports that were stronger than economists expected.
Generally speaking, strong economic data puts upward pressure on rates. This is a particularly sensitive relationship at the moment because the Fed has clearly stated it will hike rates a few more times unless the economy downshifts more abruptly than it has been. With that in mind, some of the recent data hasn't shown any downshift at all!
One solid example from this week was the business activity index in the services sector (via ISM), which rebounded massively:

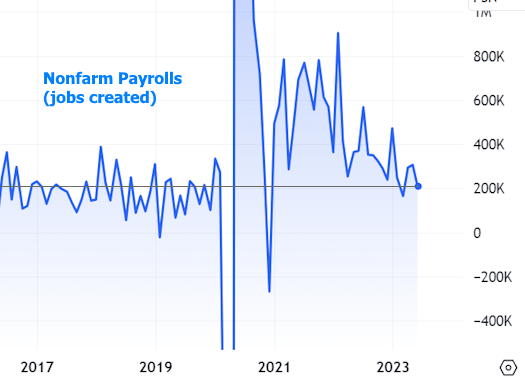
On the same morning, the ADP employment data proved to be a much bigger deal, coming in at 497k versus a median forecast of 228k. Although the track record is far from perfect, ADP's stated goal is to predict the all-important nonfarm payroll (NFP) count in the Labor Department's big monthly jobs report. In this week's case, NFP was set to come out the following morning.
Although NFP didn't nearly live up to ADP's hype, it was nonetheless solid with 209k jobs created versus forecasts calling for 225k. Wages grew a bit faster than expected, and unemployment remained near record lows at 3.6%.
While this is good news for the economy and the labor market, bonds (which drive mortgage rates) like bad news and the news wasn't bad enough for bonds to undo the damage done on Thursday.

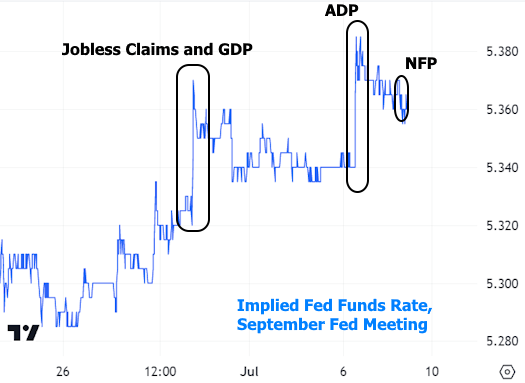
Incidentally, stocks occasionally like bad news these days too. This is a bit counterintuitive, but it has to do with the data's implication on the Fed's rate hike outlook. Specifically, the stronger data causes the market to predict a higher trajectory for the Fed Funds Rate:
In the bigger picture, the recent weakness is changing the shape of the trend in longer-term rates. The following chart uses Treasury yields to show a "breakout" from a recent trend of lower highs.

Mortgage rates are highly correlated with longer-term Treasuries so it's no surprise that they are also breaking out. In fact, they began to break out in late May and then moved even higher this week. The result is a new trend of "higher highs" that started in March:

The average lender moved well into the 7% range this week. That's much higher than suggested by Freddie Mac's weekly rate survey, which came in at 6.81% this week, but keep in mind that Freddie's survey has implied "points" (upfront loan costs that help bring the rate lower) that are not counted or reported. Contrast that to MND's index (the blue line in the chart above) which takes points into consideration. Lastly, Freddie's number is also an average of the 5 preceding days whereas MND is an up-to-the-moment check on prevailing rates.
What's next?
Expect the market to continue readily responding to economic data. One of the most important reports--the Consumer Price Index--will be out next Wednesday morning. If it shows inflation cooling more than expected, rates definitely have room to move lower. But if it takes a page out of this week's book and exceeds forecasts, rates will likely continue the trend of higher highs.
