


This past week brought the release of two housing reports that track the pace of home sales each month and they told distinctly different stories. Which one is telling the truth?
The reports in question are New Residential Sales from the Census Bureau and Pending Home Sales from the National Association of Realtors. The former focuses on new construction while the pending sales data provides an early look at potential existing home sales based on contract activity.
We'll let the charts do the talking. Here's New Home Sales:

And here's the Pending Home Sales chart:

Both charts convey post-covid volatility, but one says the housing market is stable and improving while the other says it's as bad as it's been in decades. How can two reports on home sales tell such different stories?
The answer is fairly simple: builders are actually building homes so there are actually new homes available to be sold. Moreover, builders are aggressively offering rate buydown incentives to ease the monthly payment sticker shock.
It's a different world for existing homes. Inventory is effectively non-existent. People are reluctant to sell as it often means giving up a very low rate and facing the prospect of buying a new home at drastically higher rates.

Here's New Home Inventory over the same time frame:

While it's clear that neither report is technically lying, we know you're thirsty for a verdict. We can at least conclude that gloomier message from the Pending/Existing Sales data is more on-message for the housing market due to the sheer size of that segment compared to New Homes.

The good news is that there will likely be a good measure of pent-up demand bubbling to the surface in waves whenever we finally see the interest rate environment improve.
So how about those rates?!

Ok, maybe that chart isn't so great, but look at it this way: the higher we go, the closer we are to the top. That may sound like a meaningless platitude, but there's a real kernel of logic behind it.
We know that the Fed hikes short term rates (which filter through to longer-term rates like mortgages) in order to crimp economic demand and bring prices lower. In that sense, higher rates do indeed bring about lower rates.
This is an interesting and important time for that thesis, as a matter of fact. In the past few weeks, the Fed has increasingly flagged the sharper rise in longer term rates as evidence that it doesn't need to hike short term rates anymore. The Fed has also said it is hearing talk of economic softening that's not yet showing up in the data.
This comes at a critical moment for a few reasons. First off, longer term rates actively bounced against an important ceiling over the past two weeks. The following chart shows it in terms of 10yr Treasury yields, the most commonly used benchmark for longer-term rates.
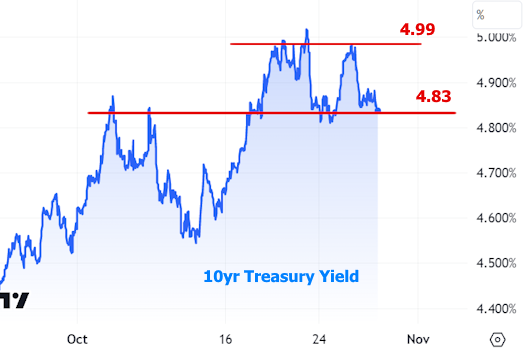
While the chart is labeled with 4.99, this is really about the big psychological impact of "5% Treasury Yields!" Some investors think that's an attractive entry point to buy bonds. Others simply think it's a big psychological level and thus time to get sideways before the next big dose of motivation arrives.
That brings us to the next few reasons for the critical timing. The next big dose of motivation stands a very good chance to be arriving in the coming week. Here's why:
- We'll get all of top tier economic data typically seen on the first week of any given month, including the exceptionally important jobs report on Friday.
- We'll hear from the Fed itself on Wednesday when the latest rate announcement comes out
- We'll see updated borrowing amounts from the U.S. Treasury for upcoming Treasury auctions (this informs rate momentum by changing the supply/demand equation).
The Fed is all but certain to leave rates unchanged on Wednesday. Moreover, given the abundance comments over the past two weeks, it might be hard for the statement or Powell's press conference to offer much by way of new ideas. Nonetheless, markets will be listening closely for more clues or confirmation about last week's ideas.
The data is of the utmost importance. If it does anything to confirm the anecdotal signs of economic softening mentioned last week, it could strongly reinforce recent rate ceilings. It's a double-edged sword, however, because if the data is strong enough, it could easily lead investors to explore 10yr yields in the 5% range. In that scenario, the average top tier mortgage rate would have a hard time staying out of the 8%+ range.
