First things first, due to the market's reaction to the Iran war, mortgage rates remain much higher than they were at the end of February. That said, they definitely did not move higher this week.
You may have seen contrary headlines on Wednesday and Thursday. The Mortgage Bankers Association (MBA) and Freddie Mac release their weekly rate surveys on those days, respectively. Both reported sharply higher rates. Both are always at risk of being stale in a dynamic rate environment.
It's not that the survey data is wrong or bad. It's just measuring something a bit different than almost any prospective mortgage borrower cares about (i.e. what kind of rate is available RIGHT NOW). The MBA and Freddie surveys are calculated using an average of the trailing 5 business days. MBA is published 3 business days after that 5 day window. Freddie is published the next day. So much can change over that time, as was the case this week.
The underlying math for every individual day isn't important. The results are easy to see on a chart overlaid with MND's daily rate index (which not only updates for any given day's rates, but even updates mid-day if a sufficient number of mortgage lenders make mid-day changes).
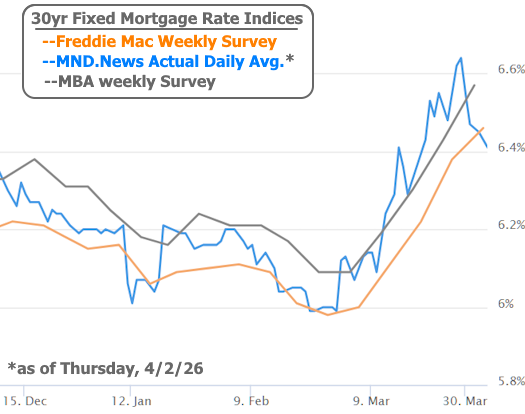
Bottom line: mortgage rates topped out on March 27th at an index value of 6.64, but have fallen roughly 0.23% since then. To put that change in perspective, consider that rates held inside a 0.23% range for the entire year up until March 11th.
Iran war headlines and oil price volatility continue as the primary source of inspiration for financial markets. Bonds (which dictate rates) are affected in two key ways.
- Bonds hate inflation. Higher inflation expectations = higher rates
- Bonds generally improve when the economy weakens. The oil price shock is creating concern among investors for economic weakness in the future, thus helping to offset some of the negative impact from the inflation expectations.
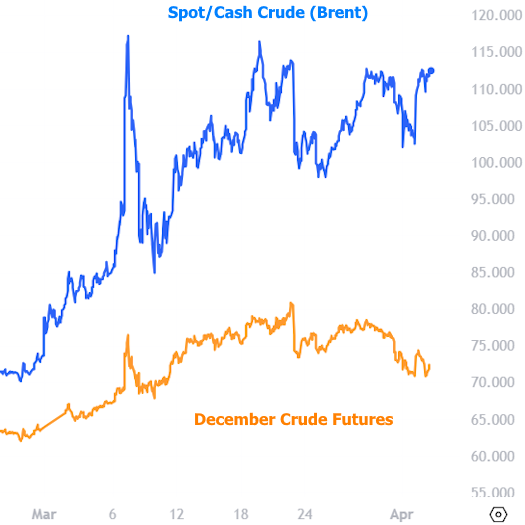
There's also some nuance in how oil prices are moving depending on how far into the future we look. Of course there's the price of physically buying oil in the present moment (referred to as "spot" or cash prices in the market). But the price of oil in the future is also heavily traded, and there are larger than normal differences between the two right now.
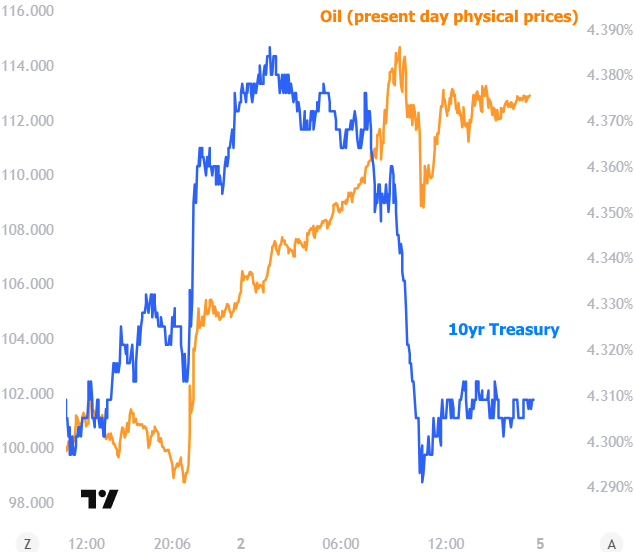
This can help us resolve some of the moments that seem counterintuitive with respect to movement in the bond market. Using Treasury yields as a barometer for interest rate movement, let's take a look at rates compared to current oil prices to see the apparent discrepancy.
Now let's look at the same chart with December's oil prices.
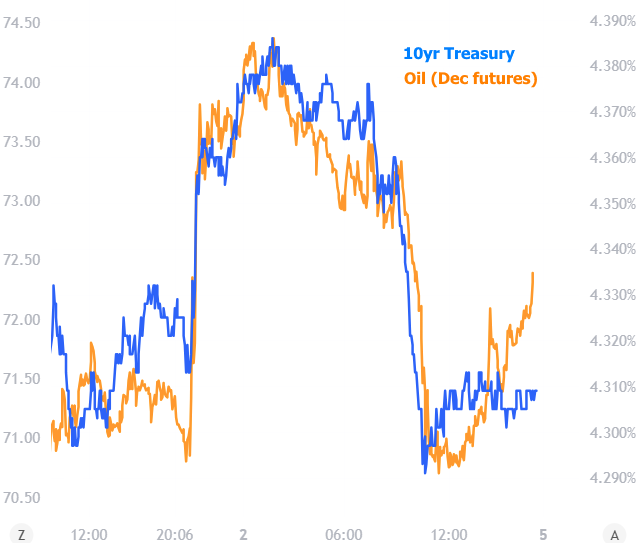
In other words, it looked like bonds/rates weren't paying much attention to oil price volatility on Wed/Thu, but they were actually simply focused on longer-term oil prices.
As for the drivers of that volatility, the source of the rate/oil spike on Wednesday night was Trump's speech involving potential escalation of the Iran war. The recovery on Thursday followed news that Iran and Oman were working on a resolution to open the Strait of Hormuz. The chart below also adds in the impact from Friday's stronger jobs report.
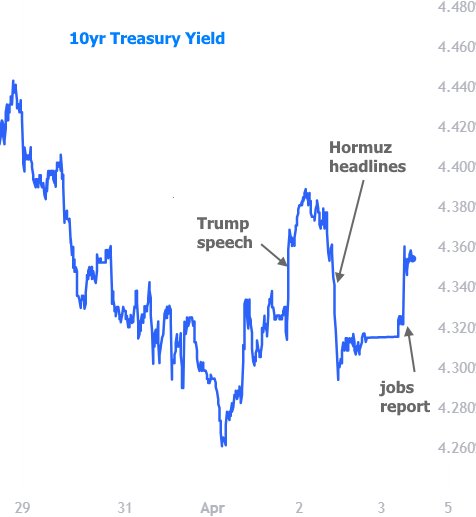
This served as a good reminder that economic data still matters. We also expect inflation data to begin having a more pronounced impact in the coming months as investors wait to see how higher fuel prices translate to the broader basket of consumer goods. Next week brings the Consumer Price Index (CPI) for March, but most analysts expect it will take more time for oil-driven inflation to make its way to the official numbers.
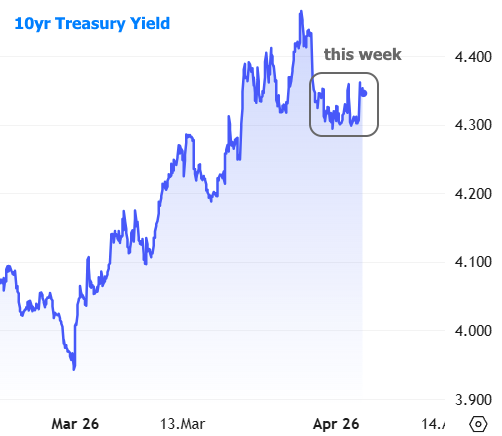
Last but not least, we need some context for the "volatility" mentioned above. This week was simply much calmer than the past few weeks. This introduces some hope that the worst of this run could be over, but the ultimate path of rates will depend on how geopolitical issues and the economy evolve.