


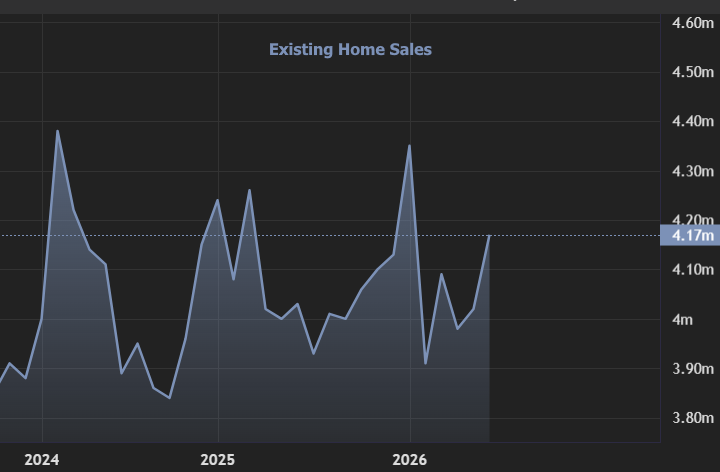
Existing-home sales picked up in May, rising to their highest level since December as improving affordability and steady household income gains continued to support demand. Sales increased 3.2% from April to a seasonally adjusted annual rate of 4.17 million, and were also 3.2% higher than a year ago.
“More Americans are on the move,” said NAR Chief Economist Lawrence Yun, noting that sales reached their strongest pace since December. He said improving affordability is helping drive the momentum, adding that mortgage rates remain below last year’s level and are roughly in line with the long-term historical average.
Inventory continued to improve in May, though supply remains relatively tight by historical standards. Total housing inventory rose to 1.55 million units, up 3.3% from April and 0.6% from a year earlier, representing a 4.5-month supply of homes.
Home prices pushed to a fresh record high in May, underscoring still-solid demand against a backdrop of limited supply. The median existing-home price climbed to $429,300, up 1.3% from a year ago and marking the 35th consecutive month of annual price gains.
Affordability also improved year-over-year, with the Housing Affordability Index rising to 105.6 from 97.5 a year earlier. Yun said income gains are still outpacing home-price growth in most parts of the country, helping keep buyers in the market despite rates ticking up from earlier this year.
Yun also pointed to the market’s healthy financial footing, saying only 1% of sales involved either a foreclosure or an underwater situation. He added that stronger sales activity tends to ripple through the broader economy, supporting everything from moving services and furniture sales to mortgage originations and lawn care.
Regional Breakdown (Sales and Prices, May 2026)
| Region | Sales (annual rate) | MoM Change | Median Price | YoY Change |
|---|---|---|---|---|
| Northeast | 460k | +2.2% | $534,900 | +4.2% |
| Midwest | 1.00m | +6.4% | $336,300 | +2.8% |
| South | 1.96m | +3.2% | $373,100 | +1.1% |
| West | 750k | 0.0% | $625,900 | -0.7% |
National Market Stats
- Total Housing Inventory: 1.55 million units (up 3.3% from April; up 0.6% YoY)
- Unsold Inventory Supply: 4.5 months (unchanged from April; down from 4.6 one year ago)
- Median Existing-Home Price: $429,300 (up 1.3% YoY; 35th consecutive yearly increase)
- Housing Affordability Index: 105.6 (up from 97.5 one year ago)
- Single-Family Sales: 3.8 million (up 3.5% MoM; up 3.3% YoY)
- Single-Family Median Price: $434,300 (up 1.3% YoY)
- Condo/Co-op Sales: 370k (unchanged MoM; up 2.8% YoY)
