Since March 1st, the Iran war has been the primary reason for movement and volatility in the bond/rate market. Pre-war motivations were woefully muted. That changed a bit with the jobs report two weeks ago and it changed again with this week's Fed announcement. Thankfully, the damage was quickly reversed.
Rates began the week on solid footing as prospects for the Iran peace deal continued to materialize. The market had mostly priced the peace deal into trading levels last Thursday, but reports of high level officials actually signing the deal helped yields push to their lowest levels in a month as of Tuesday.
The week's only meaningful volatility followed Wednesday afternoon's Fed announcement. With this being the first Fed meeting under new Chair Kevin Warsh, one could consider that the market had a bad reaction to his approach. And while that claim could be made in a roundabout way, the easier claim to prove is that the dot plot did most of the damage.
What is the dot plot?
Concurrent with the Jan/Mar/Sep/Dec meetings, the Fed also releases a summary of economic projections (SEP). Within the SEP, there is an outlook for expected Fed Funds Rate levels listed for each Fed member. It's expressed in tabular format as well as a dot plot. "The dots" have become a prime focus of rate watchers as a useful tool for understanding the Fed's reaction function.
In other words, traders make educated guesses as to how the Fed's rate expectations will evolve based on data and events. The dots confirm or modify that understanding.
In this week's case, the market was priced for the possibility of a rate hike by the end of the year, but with plenty of room for the Fed to hold steady as well. The dot plot easily confirmed the rate hike potential and arguably suggested the market needed to be even more prepared for a hike.
The following chart shows where the dots were last cycle (in March) versus yesterday (June):
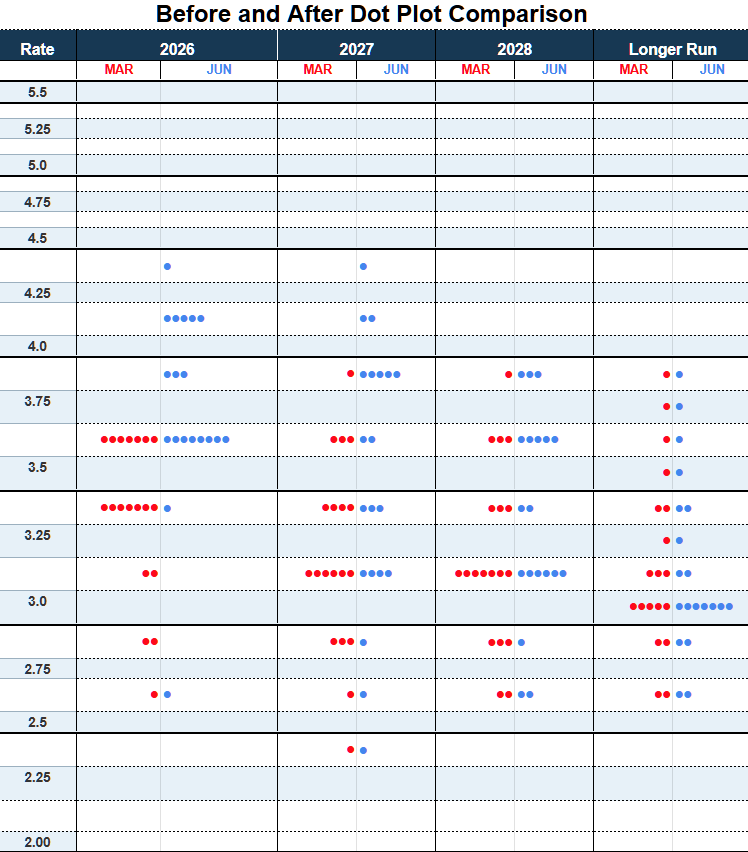
Focusing on the 2026 column, we see the median Fed member projecting zero hikes/cuts by the end of the year (3.375%) back in March compared to 3.625% this week. Additionally, 9 of the votes were 3.875% or higher versus 10 votes for 3.625% or lower. This means nearly half the FOMC sees TWO rate hikes by December.
There was also notable upward migration of dots for 2027 and 2028. All told, this was more hawkish than the market expected and there was an immediate reaction when the dot plot was released at 2pm ET.
How did Warsh come into play?
Opinions were divided over how Warsh handled his first press conference, so we'll avoid speculation and focus on facts. Contrary to many expectations, Warsh did not attempt to make a case for rate cuts (or rate hikes, for that matter). In fact, he avoided commenting on forward guidance entirely.
Importantly, he also didn't attempt to push back on the hawkish message of the dot plot. In the past, when the dots painted an obviously hawkish or dovish picture, previous Fed Chair Powell tended to offer the other side of the coin in the press conference, thus mitigating Fed Day volatility and restoring a more nuanced takeaway. While Warsh did reference the dot plot as being a highly uncertain endeavor ("written in pencil, not in pen" in his words), he did nothing to suggest those pencils were in an overly hawkish stance.
Additionally, Warsh's refusal to engage reporters on any form of forward guidance deprived the market of its ability to further refine its understanding of how the Fed may react to incoming data over the next 6 weeks. Some argued that this added uncertainty required higher risk premium in the form of weaker trading levels.
How'd it all shake out?
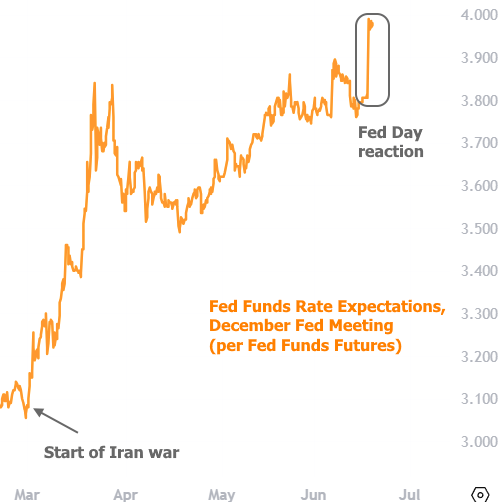
By Friday, much of the damage was undone in longer-term rates like 10yr Treasury yields and much of the damage remained in shorter term rates like 2yr Treasury yields. And the shortest-term rate indications, such as the implied Fed Funds Rate based on Fed Funds Futures, didn't recover at all. The following chart shows that expected rate for the month of December. It rose .18% after the Fed announcement and now stands almost 1% higher from before the Iran war. In other words, in late Feb, the market saw the Fed cutting twice this year. Now it sees 2 hikes.
How'd mortgage rates react to all of this?
Fortunately, the average mortgage lasts long enough to behave more like 5-10yr Treasuries and less like the super-short-term rates like Fed Funds Implied Yields and short-term Treasuries. They didn't spike egregiously on Wednesday and managed to erase half of those losses on Thursday. In fact, in the slightly bigger picture, this week's volatility was completely uneventful, even though rates remain broadly elevated relative to the last 10 months.
What's next?
Iran war updates remain important. While the memo is signed, official peace has yet to be confirmed. When that happens--and especially if oil prices continue to behave--rates could see slow and steady additional benefits. Apart from that, markets will gradually transition back to paying more attention to data with a special focus on inflation related data in order to assess lingering impacts from the recent fuel price spike.