



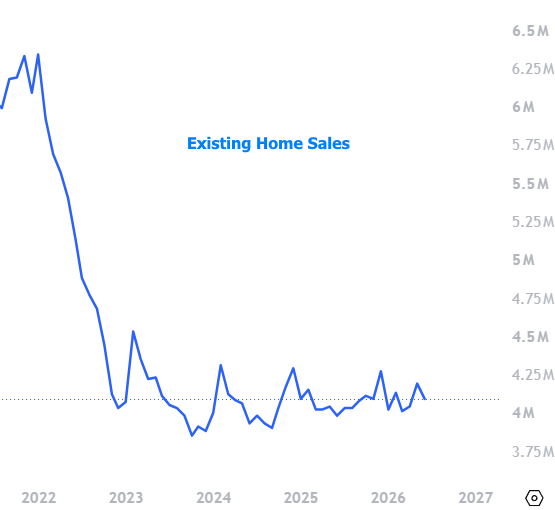
Existing-home sales eased in June after reaching a six-month high in May, as modest changes in mortgage rates continued to influence buyer activity. According to the National Association of REALTORS®, sales fell 2.4% from May to a seasonally adjusted annual rate of 4.09 million, though they remained 2.8% above their level from a year earlier.
“The back-and-forth in monthly home sales activity, driven by mild fluctuations in mortgage rates, shows how sensitive home buyers are to affordability conditions,” said NAR Chief Economist Lawrence Yun. He added that continued job growth should help support housing demand despite ongoing affordability challenges.
Housing inventory changed little during the month, suggesting that supply gains may be losing momentum. Total inventory slipped to 1.56 million units, down 0.6% from May but 1.3% higher than a year ago. At the current sales pace, unsold inventory represented a 4.6-month supply, up slightly from May and unchanged from one year earlier.
Home prices continued to climb despite softer sales activity. The median existing-home price rose to a new record of $440,600, up 1.8% from June 2025 and marking the 36th consecutive month of annual price appreciation.
Affordability improved compared with a year ago, as wage growth continued to outpace home-price gains. The Housing Affordability Index increased to 102.3, up from 95.5 a year earlier. Yun cautioned, however, that slowing inventory growth could eventually put renewed upward pressure on home prices if additional supply fails to reach the market.
Regional Breakdown (Sales and Prices, June 2026)
| Region | Sales (annual rate) | MoM Change | Median Price | YoY Change |
|---|---|---|---|---|
| Northeast | 480k | +2.1% | $564,800 | +3.9% |
| Midwest | 980k | -3.0% | $346,600 | +2.7% |
| South | 1.89m | -3.6% | $377,700 | +0.9% |
| West | 740k | -1.3% | $633,600 | +0.9% |
National Market Stats
- Total Housing Inventory: 1.56 million units (down 0.6% from May; up 1.3% YoY)
- Unsold Inventory Supply: 4.6 months (up from 4.5 months in May; unchanged from one year ago)
- Median Existing-Home Price: $440,600 (up 1.8% YoY; 36th consecutive annual increase)
- Housing Affordability Index: 102.3 (up from 95.5 one year ago)
- Single-Family Sales: 3.73 million (down 2.4% MoM; up 3.3% YoY)
- Single-Family Median Price: $446,400 (up 1.8% YoY)
- Condo/Co-op Sales: 360k (down 2.7% MoM; down 2.7% YoY)
- Condo/Co-op Median Price: $380,000 (up 1.6% YoY)