



Home prices picked up a little more speed in July, as both FHFA and the S&P Cotality Case-Shiller Home Price Indices showed stronger annual appreciation than in their previous readings. The gains remain relatively modest by historical standards, and while nominal prices are still moving higher nationally, the picture looks considerably less impressive after accounting for inflation.
The FHFA House Price Index rose 0.3% from June to July, bringing the annual increase to 2.6%. While the national market is still technically appreciating, there's more and more variation between different metro areas with some holding steady or even contracting.
Case-Shiller tells a similar story, though its national measure is running at a somewhat slower pace. The U.S. National Home Price Index rose 1.9% year over year in July, up from 1.6% in June. The 10-City Composite increased 3.4%, while the 20-City Composite was up 2.5%.
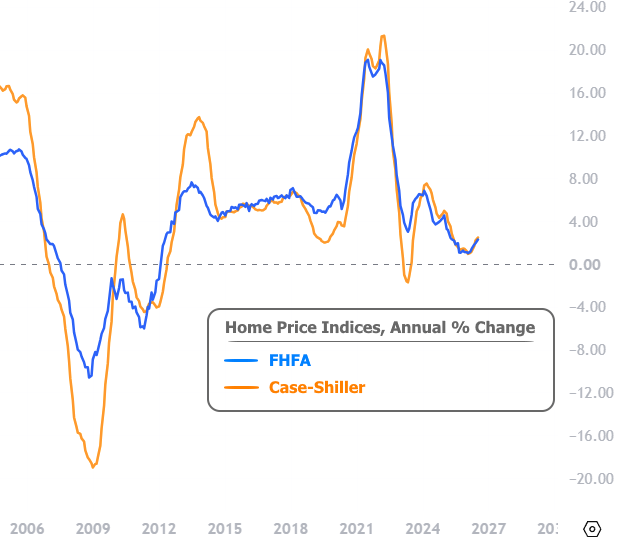
The annual price appreciation chart shows a nice little uptick, but the takeaway is tempered in inflation-adjusted terms. Both of the big U.S. inflation reports showed annual changes of 3.4% last month, and even higher in July (the month that lines up with these home price reports). Any way you slice it, that means home prices aren't keeping pace with broader inflation. Whether or not that's a bad thing is another story. Some would say it wouldn't be the end of the world for prices to merely hold steady and allow income growth to slowly chip away at affordability.
Case-Shiller's metro level numbers echo the geographical divergences. Chicago continued its remarkable run, leading the 20 tracked markets for the fifth straight month with a 6.9% annual gain. New York rose 5.8%, and Cleveland was up 4.2%. Seattle, meanwhile, remained at the opposite end of the spectrum, with prices falling 1.6% from a year earlier. Las Vegas and Denver also posted annual declines of 1.3% and 1.1%, respectively.
FHFA House Price Index
- July YoY: +2.6%
- July MoM (SA): +0.3%
- Strongest division, YoY: Middle Atlantic, +6.3%
- Weakest division, YoY: Mountain, +0.6%
S&P Cotality Case-Shiller Indices
- U.S. National YoY: +1.9%
- 10-City Composite YoY: +3.4%
- 20-City Composite YoY: +2.5%
- National MoM (SA): +0.3%
- 10-City MoM (SA): +0.4%
- 20-City MoM (SA): +0.3%