


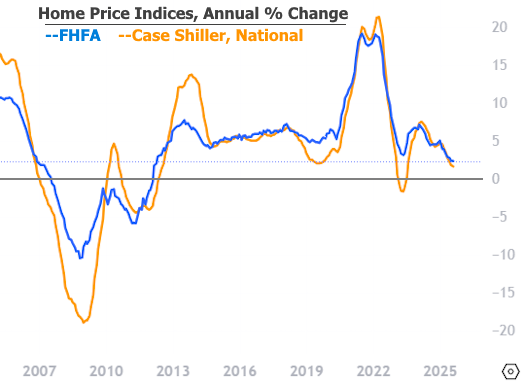
Both the FHFA and the S&P CoreLogic Case-Shiller indices released new home-price data this week covering the month of August. The message is unchanged: prices remain higher than a year ago, but the pace of appreciation continues to slow. Case-Shiller’s national annual gain eased to 1.5%, the smallest in more than 2 years, while FHFA is near its lowest annual pace since 2012.
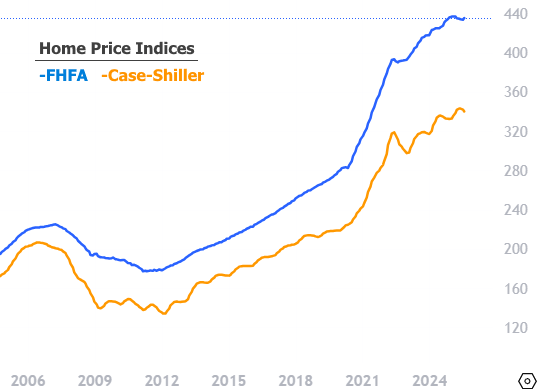
Caveat: “lowest in x years” refers to growth rate, not price levels. Index levels remain near all-time highs with only modest recent slippage—nothing like 2008–09.
The following chart represents the year over year change (%) in the index values above:
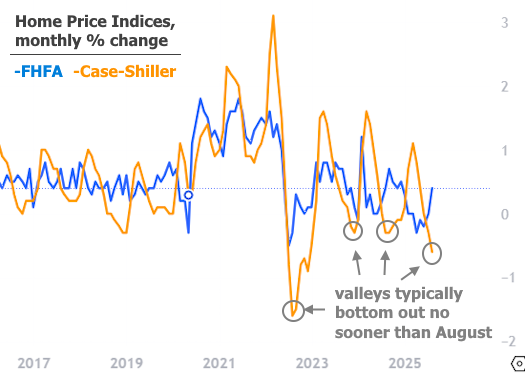
The following chart represents the month-over-month change (%) in the index levels from the first chart. NOTE: FHFA (blue line) is seasonally adjusted, meaning there are no regular peaks/valleys that correspond with typical real estate price cycle. Contrast that to Case-Shiller (orange line) which DOES show those regular peaks/valleys. On that note, August's price data (the subject of today's update) is the earliest possible month for the index to bottom out on any given year, and also an uncommon one. More typically, the bounce occurs in October (which we won't see for 2 months due to the normal reporting lag). All that to say: year-over-year price appreciation is unlikely to improve next month, especially because 2024 was one of the uncommon years where August was the lowest index value of the year.
A note on the conforming loan limit
Conforming loan limits will be updated at the end of next month. The limit is currently $806,500. Loans of that amount and lower (and higher in certain high cost areas) are eligible to be delivered as "conforming" to Fannie Mae and Freddie Mac, typically meaning they'll have lower rates and more streamlined underwriting processes.
Loan limits are updated based on quarterly FHFA data. As of the end of Q2, that quarterly data showed a 2.876% increase over last year's Q3 value. Extrapolating what we can from the monthly data reported today, that 2.876% value is probably running closer to 3.213% now. We can't be perfectly sure because the quarterly data set includes some home price info that does not appear on the monthly data. Still, it's usually pretty close. If 3.213% proves accurate, the new conforming loan limit would be just north of $832k when it's announced a month from now.
FHFA House Price Index (seasonally adjusted)
- MoM: +0.4% in August (July revised to 0.0%).
- YoY: +2.3% vs. August 2024.
S&P CoreLogic Case-Shiller (National index, NSA unless noted)
- YoY: +1.5% in August, down from +1.6% prior.
- 10-City: +2.1% YoY; 20-City: +1.6% YoY.
- MoM (SA): +0.2% for National, 10-City, and 20-City.
Seasonally Adjusted Comparison
| Index | MoM (SA) | YoY |
|---|---|---|
| FHFA HPI | +0.4% | +2.3% |
| Case-Shiller (National) | +0.2% | +1.5% |
Longer-Term View: YoY Trends
- FHFA’s +2.3% is among the lowest annual growth rates since 2012.
- Case-Shiller’s +1.5% is the weakest national pace in more than 2 years.
