The first week of any given month tends to have the highest concentration of economic data with the power to influence the bond market, and thus interest rates. This week was no exception.
In addition to the scheduled economic data, there was unscheduled drama in the banking sector. This involved the orderly failure of First Republic Bank, rumors of other imminent bank failures, and a run on various bank stocks that ultimately required multiple "circuit breakers" (temporary halts to trading due to the size and speed of price changes).
Bank drama coincided with lower job openings on Tuesday morning to send bond yields lower on Tuesday morning. This was easier to see in 2yr Treasury yields compared to the 10yr Treasuries that we typically follow because shorter-term bonds have more in common with the Fed Funds Rate.
A day later, we heard from the Fed itself with the widely anticipated 0.25% hike to the Fed Funds Rate. Despite the hike, interest rates continued broadly lower into mid week (here's why) before bouncing after Friday's stronger jobs report.

All told, 10yr yields traded a range of roughly 0.25% whereas 2yr yields saw a range closer to 0.50%. That's a volatile week by any standard, but it nonetheless failed to blaze any new trails with respect to the range we've been following in the 10yr. One might have argued that yields were pushing the lower boundary of the range had it not been for NFP ("nonfarm payrolls," the main component of the jobs report) on Friday.

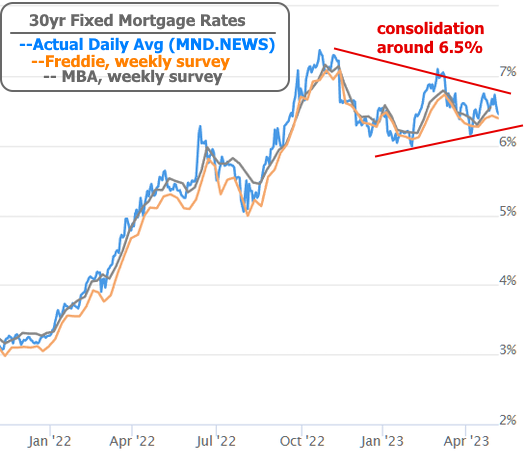
Mortgage rates haven't necessarily been keeping pace with Treasuries, but they've been just as sideways. In fact, rates have been consolidating in a narrower pattern surrounding a conventional 30yr fixed rate of 6.5%.
Whereas this week's volatility was well-distributed across multiple days and events, next week's potential volatility is highly concentrated on Wednesday morning. That's when the latest monthly installment of the Consumer Price Index (CPI) will be released.
CPI is the biggest market mover among the various inflation reports that come out each month. It's the only report that could legitimately challenge NFP as THE most important monthly data over the past few years. Every new update on inflation is particularly interesting right now because the market is actively trying to determine if inflation in check and declining, or if it is persistent enough as to require more rate hikes from the Fed. This indecision is what the consolidation pattern in mortgage rates is all about.
The most important figure in the CPI data is the monthly "core" reading which excludes more volatile, less elastic food and energy prices. It topped out at 0.8% at the highest levels and although it has come down a bit, it's still well above the target range.
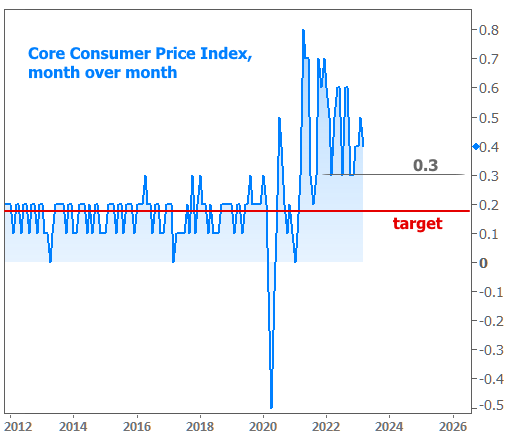
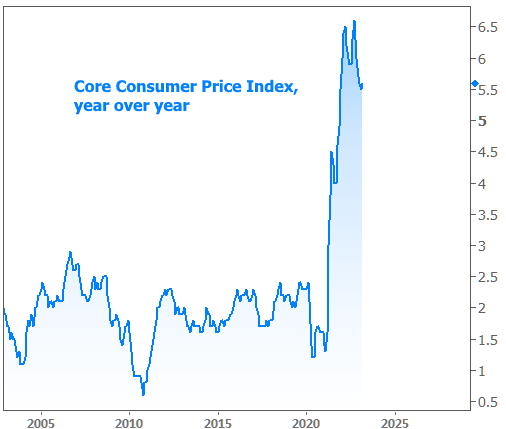
It will take 12 months of 0.167% core inflation to hit the 2% target. Obviously, there's a long way to go, but if the market is convinced that we're headed in that direction, rates would be much lower than they are now. The year-over-year chart is still anything but convincing.