


Home price appreciation slowed further in March and through the first quarter of 2026, according to the latest data from both FHFA and the S&P Cotality Case-Shiller Home Price Indices. While national prices continued to edge higher on a nominal basis, both reports pointed to a housing market struggling to maintain momentum as affordability pressures and elevated mortgage rates continued to weigh on demand.
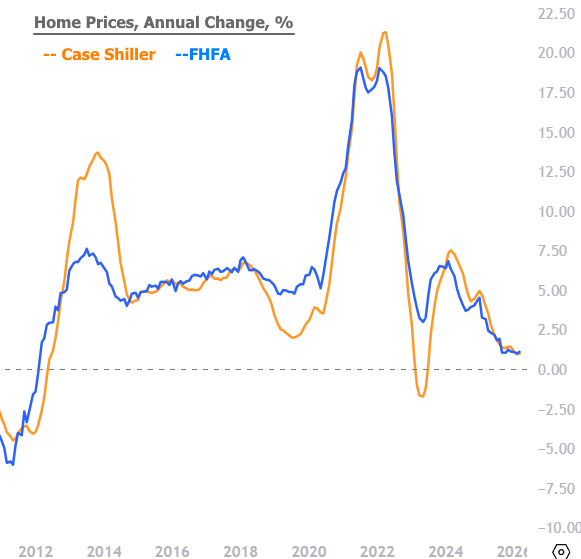
FHFA reported that U.S. house prices rose 1.7% year-over-year in the first quarter of 2026, matching the prior quarter’s annual pace. On a quarterly basis, prices increased 0.5% from Q4 2025, while the agency’s seasonally adjusted monthly index posted a modest 0.1% gain in March from February.
Regional FHFA data continued to show a sharply divided housing market. Seven of the nine census divisions posted annual price gains, led by the East North Central division at +4.4%. By contrast, the West South Central division recorded a 0.7% decline. At the state level, Illinois led annual appreciation at 7.3%, while Colorado posted the steepest decline at -2.4%.
Metro-level results reflected similar divergence. FHFA said home prices increased in 65 of the 100 largest metropolitan areas over the past year, with Elgin, Illinois posting the strongest appreciation at 10.8%. Meanwhile, Austin-Round Rock-San Marcos, Texas recorded the largest decline at -6.9%, underscoring ongoing softness across portions of the Sun Belt.
The S&P Cotality Case-Shiller U.S. National Home Price Index showed a similar pattern of slowing appreciation. The national index rose 0.7% year-over-year in March, down slightly from February’s 0.8% increase. The 10-City Composite rose 1.4%, while the 20-City Composite increased 0.8%, both slowing from the prior month.
Case-Shiller data showed the slowdown broadening geographically. More than half of the 20 tracked metropolitan areas posted annual price declines in March. Seattle recorded the weakest annual performance at -2.5%, followed by Denver (-2.0%), Tampa (-1.9%), Dallas (-1.7%), and Phoenix (-1.6%). Los Angeles (-1.6%) and Washington (-0.1%) also remained in negative territory.
Midwest and Northeast markets continued to outperform. Chicago led all major metros with a 6.1% annual increase, followed by New York at 4.0% and Cleveland at 3.0%. The widening gap between stronger Midwestern markets and weaker Western and Sun Belt regions continued to highlight how localized housing conditions have become.
Despite some seasonal strength in unadjusted spring data, underlying momentum remained weak. After seasonal adjustment, both the national Case-Shiller index and the 20-City Composite posted 0.2% monthly declines in March, while the 10-City Composite slipped 0.03%. S&P noted that national home prices have risen just 0.3% over the past six months, suggesting the market is effectively at a standstill.
March was the tenth consecutive month in which inflation outpaced price appreciation, again leading to real home values declining in March. Combined with mortgage rates that moved back toward the mid-6% range by the end of the month, both reports suggest affordability pressures remain a significant constraint on buyer demand and future price growth.
FHFA House Price Index
- March MoM (SA): +0.1%
- Q1 2026 QoQ: +0.5%
- YoY: +1.7%
S&P Cotality Case-Shiller Indices
- U.S. National YoY: +0.7%
- 10-City Composite YoY: +1.4%
- 20-City Composite YoY: +0.8%
- National MoM (SA): -0.2%
- 20-City MoM (SA): -0.2%
- 10-City MoM (SA): -0.03%